Intact FGF23 ELISA Kit | BI-20700
-
Method
Sandwich ELISA, HRP/TMB, 12×8-well detachable strips
-
Sample type
Plasma (EDTA, citrate, heparın), serum, urine, cell culture supernatant
-
Sample volume
50 µl / well
-
Assay time
3 h / 30 min
-
Sensitivity
5.4 pg/ml (= 0.21 pmol/l)
-
Standard range
0 – 1 600 pg/ml (= 0 – 60.8 pmol/l)
-
Conversion factor
1 pg/ml = 0.038 pmol/l; MW: 26 kDa
-
Specificity
Endogenous and recombinant human intact FGF23.
-
Cross-reactivity
The assay does not cross-react with FGF3, FGF19, and FGF21.
-
Precision
In-between-run (n=9): ≤ 6 % CV
Within-run (n=3): ≤ 8 % CV
-
Validation Data
See validation data tab for: precision, accuracy, dilution linearity, values for healthy donors, etc
-
Use
Research use only
Intact FGF23 ELISA Product Overview
The human intact FGF23 ELISA Kit is a one-step, 96-well sandwich ELISA for the quantitative determination of intact FGF 23 in human plasma. TheFGF-23 ELISA employs human plasma-based standards to ensure the measurement of biologically reliable data.
Intact FGF23 ELISA Assay Principle
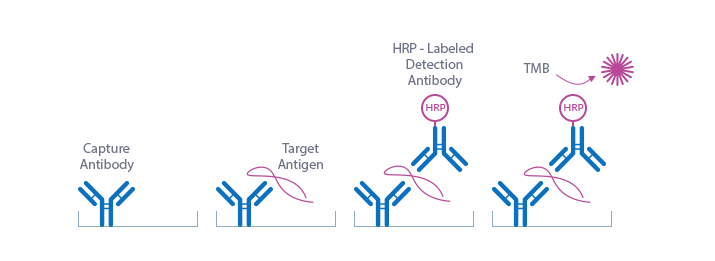
The human FGF 23 intact ELISA kit is a sandwich enzyme immunoassay that has been optimized and validated for the quantitative determination of intact FGF23 in human plasma samples. Serum and other sample types are compatible with this ELISA.
Figure explaining the principle of the human intact FGF-23 ELISA kit:
Capture antibody: monoclonal recombinant anti-human FGF23 antibody
Detection antibody: monoclonal mouse anti-human FGF23 antibody, HRP-labeled
Target antigen: human intact FGF23
In a first step, standard/control/sample and conjugate (monoclonal mouse anti-human FGF23-HRP) are pipetted into the wells of the microtiter strips, which are pre-coated with monoclonal recombinant anti-human FGF23 antibody. FGF23 present in the standard/control/sample binds to the pre-coated antibody in the well and forms a sandwich with the conjugated anti-human FGF23-HRP antibody. In the washing step all non-specific unbound material is removed. In a second step, the substrate (TMB, tetramethylbenzidine) is pipetted into the wells. The enzyme-catalyzed color change of the substrate is directly proportional to the amount of intact FGF23 present in the sample. This color change is detectable with a standard microplate reader. A dose response curve of the absorbance (optical density, OD at 450 nm) versus standard concentration is generated using the values obtained from the standards. The concentration of intact FGF23 in the sample is determined directly from the dose response curve.
Principle of the Detection of intact FGF23
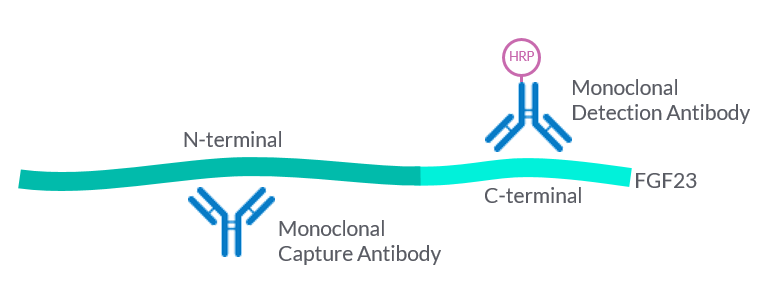
The FGF23 (intact) human ELISA is a sandwich-based immunoassay with a recombinant monoclonal anti-human FGF23 capture antibody recognizing a structural epitope in the N-terminal part of FGF23. Detection is mediated by a HRP-labeled monoclonal anti-human FGF23 antibody directed to the C-terminal part of FGF23. Therefore, specific measurement of intact FGF23 is ensured.
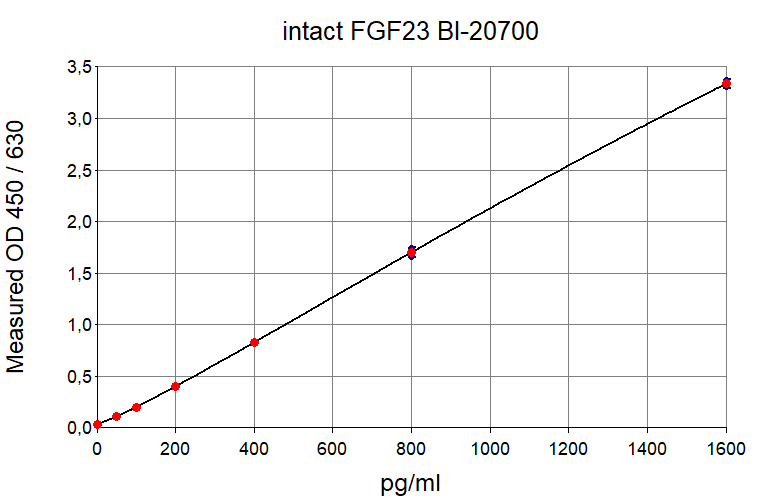
Intact FGF23 ELISA Typical Standard Curve
The figure below shows a typical standard curve for the human FGF23 ELISA. The immunoassay is calibrated against recombinant human intact FGF23:
Intact FGF23 ELISA Kit Components
|
Contents |
Description |
Quantity |
|
PLATE |
Recombinant monoclonal anti-human FGF23 antibody precoated microtiter strips in strip holder, packed in aluminum bag with desiccant |
12 x 8 tests |
|
WASHBUF |
Wash buffer concentrate 20x, natural cap |
1 x 50 ml |
|
ASYBUF |
Assay buffer, red cap, ready to use |
1 x 10 ml |
|
STD |
Standards (0; 50; 100; 200; 400; 800; 1600 pg/ml), recombinant human intact FGF23 in human plasma, white caps, lyophilized |
7 vials |
|
CTRL |
Control A and B, yellow caps, lyophilized, exact concentrations see labels |
2 vials |
|
CONJ |
Conjugate (monoclonal mouse anti-human FGF23-HRP), amber cap, ready to use |
1 x 7 ml |
|
SUB |
Substrate (TMB solution), blue cap, ready to use |
1 x 13 ml |
|
STOP |
Stop solution, white cap, ready to use |
1 x 7 ml |
Storage instructions: All reagents of the FGF23 (intact) human ELISA kit are stable at 2-8°C until the expiry date stated on the label of each reagent.
Sample Collection & Storage
EDTA plasma, heparın plasma,citrate plasma, serum, urine and cell culture supernatant are suitable for use in this assay. Do not change sample type during studies. We recommend duplicate measurements for all samples, standards and controls. The sample collection and storage conditions listed are intended as general guidelines.
Serum & Plasma
Collect venous blood samples in standardized serum separator tubes (SST) or standardized blood collection tubes using EDTA, heparın or citrate as an anticoagulant. For serum samples, allow samples to clot for 30 minutes at room temperature. Perform separation by centrifugation as soon as possible according to the tube manufacturer’s instructions for use. Assay the acquired samples immediately or aliquot and store at -25°C or lower. Lipemic or haemolyzed samples may give erroneous results. Samples are stable for at least four freeze-thaw cycles.
Note: the experiments performed to measure intact FGF23 in serum samples did not undergo a full validation according to ICH/FDA/EMEA guidelines. Values obtained for serum samples are lower than those obtained for plasma samples. For more information please refer to the validation data.
Urine
Aseptically collect the first urine of the day (mid-stream), voided directly into a sterile container. Centrifuge to remove particulate matter, assay immediately or aliquot and store at -25°C or lower.
Note: the experiments performed to measure intact FGF23 in urine samples did not undergo a full validation according to ICH/FDA/EMEA guidelines. However, our performance check suggests that urine samples can be measured with this ELISA. For more information please refer to the validation data.
Cell Culture Supernatant
Remove particulates by centrifugation and assay immediately or aliquot and store samples at -25°C or lower.
Note: the experiments performed to measure intact FGF23 in cell culture supernatant samples did not undergo a full validation according to ICH/FDA/EMEA guidelines. However, our performance check suggests that cell culture supernatant samples can be measured with this ELISA. For more information please refer to the validation data.
Reagent Preparation
Wash Buffer
|
1. |
Bring the WASHBUF concentrate to room temperature. Crystals in the buffer concentrate will dissolve at room temperature. |
|
2. |
Dilute the WASHBUF concentrate 1:20, e.g. 50 ml WASHBUF + 950 ml distilled or deionized water. Only use diluted WASHBUF when performing the assay. |
The diluted WASHBUF is stable up to one month at 4°C (2-8°C).
Standards & Controls for Plasma, Serum and Urine Measurements
|
1. |
Pipette 400 µl of distilled or deionized water into each standard (STD) and control (CTRL) vial. The exact concentration is printed on the label of each vial. |
|
2. |
Leave at room temperature (18-26°C) for 15 min. Vortex gently. |
Reconstituted STD and CTRL are stable for 3 h at room temperature (18-24°C). STD and CTRL are stable at -25°C or lower until expiry date stated on the label. STDs and CTRLs are stable for four freeze-thaw cycles.
Note: The above protocol can be used for serum and urine measurements. Please note that the ELISA has been validated for plasma only.
Standards for Cell Culture Supernatant Measurements
For the preparation of a cell culture-based standard curve always use the identical cell culture medium (CCM) as used for the experiment.
|
1. |
Reconstitute standard 7 (STD7) in 400 µl deionized water. Leave at room temperature (18-26°C) for 15 min and mix well before making dilutions. Use polypropylene tubes. |
|
2. |
Mark tubes ccSTD6 to ccSTD1. Dispense 50 µl cell culture medium into each vial. |
|
3. |
Pipette 50 µl of STD7 into tube marked as ccSTD6. Mix thoroughly. |
|
4. |
Transfer 50 µl of ccSTD6 into the tube marked as ccSTD5. Mix thoroughly. |
|
5. |
Continue in the same fashion to obtain ccSTD4 to ccSTD2. CCM serves as the ccSTD1 (0 pg/l intact FGF23). |
|
6. |
Using the prepared standards, follow the protocol as indicated for serum, plasma and urine samples. |
Attention: Supplied STD1-STD7 and controls are only valid for plasma, serum, and urine and should not be used for cell culture measurements.
Sample Preparation
Bring samples to room temperature and mix gently to ensure the samples are homogenous. We recommend duplicate measurements for all samples.
Samples for which the OD value exceeds he highest point of the standard range (STD7) can be diluted 1:11 (1+10, e.g. 10 μl sample + 100 μl ASYBUF).
The kit includes sufficient assay buffer (ASYBUF) for a 1:11 dilution of 40 samples (in duplicates). Additional ASYBUF can be ordered (BI-20700-ASYBUF).
Intact FGF23 ELISA Assay Protocol
Read the entire protocol before beginning the assay.
|
1. |
Bring samples and reagents to room temperature (18-24°C). |
|
2. |
Mark positions for STD/CTRL/SAMPLE (standard/control/sample) on the protocol sheet. |
|
3. |
Take microtiter strips out of the aluminum bag. Store unused strips with desiccant at 4°C in the aluminum bag. Strips are stable until expiry date stated on the label. |
|
4. |
Pipette 50 µl STD/CTRL/SAMPLE (standard/control/sample) in duplicates into respective wells. |
|
5. |
Add 50 µl CONJ (conjugate, amber cap) into each well, mix gently. |
|
6. |
Cover the plate and incubate for 3 hrs at room temperature. |
|
7. |
Aspirate and wash wells 5x with 300 µl diluted WASHBUF (wash buffer). After the final wash, remove remaining WASHBUF by strongly tapping the plate against a paper towel. |
|
8. |
Add 100 µl SUB (substrate, blue cap) into each well. Swirl gently. |
|
9. |
Incubate for 30 min at room temperature (18-24°C) in the dark. |
|
10. |
Add 50 µl STOP (stop solution, white cap) into each well. Swirl gently. |
|
11. |
Measure absorbance immediately at 450 nm with reference 630 nm, if available. |
Calculation of Results
Construct a standard curve from the absorbance read-outs of the standards using commercially available software capable of generating a four-parameter logistic (4-PL) fit. Alternatively, plot the standards’ concentration on the x-axis against the mean absorbance for each standard on the y-axis and draw a best fit curve through the points on the graph. Curve fitting algorithms other than 4-PL have not been validated and will need to be evaluated by the user.
Obtain sample concentrations from the standard curve. If required, the pg/ml concentration can be converted into pmol/l by applying a conversion factor (1 pg/ml = 0.038 pmol/l; MW: 26 kDa). Respective dilution factors have to be considered when calculating the final concentration of the sample.
The quality control protocol supplied with the kit shows the results of the final release QC for each kit lot. Data for optical density obtained by customers may differ due to various influences and/or due to the normal decrease of signal intensity during shelf life. However, this does not affect validity of results as long as an OD of 1.50 or more is obtained for the standard with the highest concentration and the values of the CTRLs are in range (target ranges see labels).
FGF23 Protein
FGF23 (fibroblast growth factor 23) is a member of the fibroblast growth factor family and controls phosphate and vitamin D homeostasis. The full-length protein comprises 251 amino acids including a 24 amino acid signal peptide. The N-terminal FGF homology region of FGF23 is separated from the unique C-terminal region by a proteolytic cleavage site. A proportion of FG23 is proteolytically processed between arginine179 and serine180 to generate N-terminal and C-terminal fragments. Therefore, the major forms of FGF23 present in human circulation are hormonally intact FGF23 and inactive N-terminal and C-terminal fragments. FGF23 binds to FGF receptor 1c (FGFR1c) with its N-terminal region, while the C-terminal region is capable of interacting with the co-receptor αKlotho to confer high-affinity binding to the receptor. FGFR1c and αKlotho are expressed in the distal nephron and the parathyroid gland. Co-receptor independent signaling of FGF23 has been described for other FGFRs, which are expressed in a variety of tissues. The main source of FGF23 are osteocytes in the bone.
|
Molecular weight |
26 kDa |
|
Cellular localization |
Extracellular |
|
Post-translational modifications |
Glycosylation, phosphorylation |
|
Sequence similarities |
Member of the fibroblast growth factor (FGF) family |
|
Alternative names |
Fibroblast growth factor 23, ADHR, FGFN, HPDR2, HYPF, PHPTC, HFTC2 |
|
Entrez/NCBI ID |
|
|
Genecards |
|
|
OMIM |
|
|
PDB |
|
|
Pfam |
|
|
Protein Atlas |
|
|
Uniprot ID |
FGF23 Function
FGF23 is an endocrine hormone regulating phosphate homeostasis by modulating renal phosphate reabsorption, vitamin D metabolism and parathyroid hormone (PTH) secretion. Increased dietary phosphate intake or reduced phosphate excretion due to renal insufficiency stimulates FGF23 secretion in the bone. FGF23 induces the internalization of phosphate transporters in the kidney and thus, reduces phosphate reabsorption. The subsequent renal excretion of phosphate (phosphaturia) restores phosphate balance. PTH and active vitamin D (1,25-dihydroxyvitamin D) both stimulate FGF23 secretion and are suppressed by rising FGF23 levels in a negative feedback loop. FGF23 inhibits the activation of 25-hydroxyvitamin D into 1,25 dihydroxyvitamin D through downregulation of the enzyme 1α-hydroxylase catalyzing this metabolic step. At the same time, FGF23 promotes the upregulation of 24-hydroxylase, an enzyme mediating the inactivation of 1,25 dihydroxyvitamin D. FGF23-induced downregulation of active vitamin D limits the gastrointestinal uptake of phosphate and thus, contributes to the phosphate lowering effects of FGF23. Since PTH releases phosphate from bone, FGF23-mediated suppression of PTH secretion builds the third axis by which phosphate homeostasis is controlled by FGF23.
In humans, circulating levels of FGF23 can be altered in both genetic and acquired diseases. A primary excess in circulating intact FGF23 is the underlying cause of diseases like X-linked hypophosphatemic rickets (XLH), autosomal dominant/recessive hypophosphatemic rickets (ADHR/ARHR) or tumor-induced osteomalacia. The excessive FGF23 levels in these diseases cause renal phosphate wasting, low active vitamin D concentrations and defective mineralization of bones. In case of a genetic disease, the mutations accounting for hyperphosphatemia or hypophosphatemia are located in either the FGF23 gene itself or one of its regulators. In ADHR, missense mutations in the FGF23 gene inhibit the cleavage into N- and C-terminal fragments and thus, increase the amount of circulating intact FGF23. However, the exact molecular mechanisms by which some mutations other than in the FGF23 gene itself are causing FGF23-related disease is not yet fully understood.
Circulating FGF23 is also elevated in patients with chronic kidney disease (CKD), presumably in response to decreased renal excretion of phosphate. During the course of the disease, FGF23 secretion is upregulated and the ratio between C-terminal and intact FGF23 is shifted towards the intact protein. Simultaneous upregulation of FGF23 cleavage in osteocytes maintains near-normal levels of biologically active, intact circulating FGF23, whereas downregulated or impaired FGF23 cleavage may contribute to elevated intact serum FGF23 in CKD. The increase in FGF23 concentration in CKD patients is accompanied by low levels of active vitamin D and secondary hyperparathyroidism. Increased FGF23 in CKD patients is not only associated with disease progression, but also with left ventricular hypertrophy and endothelial dysfunction.
Besides hyperphophatemia, other conditions associated with CKD such as acidosis, tissue hypoxia, iron deficiency, and inflammation may also contribute to the increase in FGF23 levels. Iron stimulates FGF23 production and is counterbalanced by increased cleavage of newly synthesized FGF23 within healthy osteocytes. As a result, FGF23 fragments are elevated, but serum phosphate levels remain normal due to normal circulating levels of biologically active FGF23. Inflammation plays an essential role in FGF23 regulation as it triggers FGF23 expression and cleavage thus revealing its pro-inflammatory and immune-modulatory properties.
Epidemiological data suggests that higher FGF23 concentrations are associated with all-cause mortality, cardiovascular mortality, a higher risk of myocardial infarction, stroke and heart failure. Furthermore, FGF23 levels could induce left ventricular hypertrophy, potentially via direct but FGFR1c- and α-klotho-independent signaling in the heart.
-
Cancer
- Tumor-induced osteomalacia
- Familial tumor calcinosis
-
Cardiovascular Disease
- Heart failure
- Left-ventricular hypertrophy
- Vascular calcification
-
Endocrine disorders
- Primary hyperparathyroidism
- Secondary hyperparathyroidism
-
Kidney Disease
- Chronic kidney disease (CKD)
- Chronic kidney disease-mineral and bone disorder (CKD-MBD)
- Chronic kidney disease and cardiovascular disease
- Acute kidney injury
Literature
α-Klotho is a non-enzymatic molecular scaffold for FGF23 hormone signalling.
Chen, G., Liu, Y., Goetz, R., Fu, L., Jayaraman, S., Hu, M.-C., Moe, O.W., Liang, G., Li, X., Mohammadi, M., 2018. Nature 553, 461–466.
PMID: 29342138; PMCID: PMC6007875
Physiology of FGF23 and overview of genetic diseases associated with renal phosphate wasting
Bachetta, J., Bardet, C., Prié, D., 2019. Metab. Clin. Exp.
PMID: 30664852
Renal and extrarenal effects of fibroblast growth factor 23.
Vervloet M, Nature Rev 2019; 15:109-119.
PMID:30514976
FGF23 beyond Phosphotropic Hormone
Takashi, Y., Fukumoto, S., 2018. Trends Endocrinol. Metab.
PMID: 30217676
FGF23 in Cardiovascular Disease: Innocent Bystander or Active Mediator?
Stöhr, R., Schuh, A., Heine, G.H., Brandenburg, V., 2018. Front. Endocrinol.
PMID: 30013515; PMCID: PMC6036253
FGF23 Actions on Target Tissues—With and Without Klotho
Richter, B., Faul, C., 2018. Front. Endocrinol.
PMID: 29770125; PMCID: PMC5940753
Physiological Actions of Fibroblast Growth Factor-23
Erben, R., 2018. Front. Endocrinol.
PMID: 29892265; PMCID: PMC5985418
All Biomedica ELISAs are validated according to FDA/ICH/EMEA guidelines. For more information about our validation guidelines, please refer to our quality page and published validation guidelines and literature.
- ICH Q2(R1) Validation of Analytical Procedures: Text and Methodology.
- EMEA/CHMP/EWP/192217/2009 Guideline on bioanalytical method validation.
- Bioanalytical Method Validation, Guidance for Industry, FDA, May 2018
Calibration
The FGF23 (intact) human immunoassay is calibrated against human intact FGF23 (AA25-251 of Uniprot ID Q9GZV9).
Intact FGF23 ELISA Detection Limit & Sensitivity
To determine the sensitivity of the FGF23 (intact) human ELISA, experiments measuring the lower limit of detection (LOD) and the lower limit of quantification (LLOQ) were conducted.
The LOD, also called the detection limit, is the lowest point at which a signal can be distinguished above the background signal, i.e. the signal that is measured in the absence of FGF23, with a confidence level of 99%. It is defined as the mean back calculated concentration of standard 1 (0 pmol/l of FGF23, five independent measurements) plus three times the standard deviation of the measurements.
The LLOQ, or sensitivity of an assay, is the lowest concentration at which an analyte can be accurately quantified. The criteria for accurate quantification at the LLOQ are an analyte recovery between 75 and 125% and a coefficient of variation (CV) of less than 25%. To determine the LLOQ, standard 2, i.e. the lowest standards containing FGF23, is diluted, measured five times and its concentration back calculated. The lowest dilution, which meets both criteria, is reported as the LLOQ.
The following values were determined for the FGF23 (intact) human ELISA:
|
LOD |
5.4 pg/ml |
|
LLOQ |
12.5 pg/ml |
Intact FGF23 ELISA Precision
The precision of an ELISA is defined as its ability to measure the same concentration consistently within the same experiments carried out by one operator (within-run precision or repeatability) and across several experiments using the same samples but conducted by several operators at different locations using different ELISA lots (in-between-run precision or reproducibility).
Within-Run Precision
Within-run (intra-assay) precision was tested by measuring two samples three times within one FGF23 (intact) ELISA lot. The experiment was conducted by one operator.
|
ID |
n |
Mean iFGF23 [pg/ml] |
SD [pg/ml] |
CV (%) |
|
Sample 1 |
3 |
99 |
8.4 |
8 |
|
Sample 2 |
3 |
800 |
10.2 |
1 |
In-Between-Run Precision
In-between-run (inter-assay) precision was assessed by measuring two samples of known concentrations nine times within three FGF23 (intact) ELISA lots by two operators.
|
ID |
n |
Mean iFGF23 [pg/ml] |
SD [pg/ml] |
CV (%) |
|
Sample 1 |
9 |
103 |
5.9 |
6 |
|
Sample 2 |
9 |
803 |
15.2 |
2 |
Intact FGF23 ELISA Accuracy
The accuracy of an ELISA is defined as the precision with which it can recover samples of known concentrations.
The recovery of the FGF23 (intact) human ELISA was measured by adding recombinant intact FGF23 to samples containing a known concentration endogenous intact FGF23. The %recovery of the spiked concentration was calculated as the percentage of measured compared over the expected value.
This table shows the summary of the recovery experiments in the FGF23 (intact) human ELISA in different sample matrices:
|
% Recovery |
|||||
|
+160 pg/ml |
+800 pg/ml |
||||
|
Sample matrix |
n |
Mean |
Range |
Mean |
Range |
|
EDTA plasma |
6 |
94 |
90-103 |
100 |
92-109 |
|
Heparın plasma |
1 |
82 |
- |
79 |
- |
|
Citrate plasma |
1 |
97 |
- |
103 |
- |
|
Serum |
6 |
70 |
61-78 |
91 |
81 - 101 |
Data showing recovery of recombinant intact FGF23 in human EDTA plasma samples:
|
iFGF23 [pg/ml] |
% Recovery |
|||||
|
Sample matrix |
ID |
Reference |
+160 pg/ml |
+800 pg/ml |
+160 pg/ml |
+800 pg/ml |
|
EDTA plasma |
e1 |
35 |
189 |
886 |
98 |
109 |
|
EDTA plasma |
e2 |
23 |
168 |
789 |
92 |
97 |
|
EDTA plasma |
e3 |
20 |
163 |
788 |
91 |
97 |
|
EDTA plasma |
e4 |
26 |
168 |
818 |
90 |
101 |
|
EDTA plasma |
e5 |
56 |
216 |
871 |
103 |
105 |
|
EDTA plasma |
e6 |
32 |
172 |
749 |
90 |
92 |
|
|
|
Mean |
94 |
100 |
||
|
|
|
|
|
Min |
90 |
92 |
|
|
|
|
|
Max |
103 |
109 |
Data showing recovery of recombinant intact FGF23 in human heparın plasma samples:
|
iFGF23 [pg/ml] |
% Recovery |
|||||
|
Sample matrix |
ID |
Reference |
+160 pg/ml |
+800 pg/ml |
+160 pg/ml |
+800 pg/ml |
|
Herparin plasma |
h1 |
22 |
150 |
646 |
82 |
79 |
Data showing recovery of recombinant intact FGF23 in human citrate plasma samples:
|
iFGF23 [pg/ml] |
% Recovery |
|||||
|
Sample matrix |
ID |
Reference |
+160 pg/ml |
+800 pg/ml |
+160 pg/ml |
+800 pg/ml |
|
Citrate plasma |
c1 |
26 |
178 |
834 |
97 |
103 |
Data showing recovery of recombinant intact FGF23 in human serum samples:
|
iFGF23 [pg/ml] |
% Recovery |
|||||
|
Sample matrix |
ID |
Reference |
+160 pg/ml |
+800 pg/ml |
+160 pg/ml |
+800 pg/ml |
|
Serum |
s1 |
13 |
136 |
742 |
78 |
92 |
|
Serum |
s2 |
7 |
119 |
713 |
71 |
89 |
|
Serum |
s3 |
7 |
116 |
689 |
69 |
86 |
|
Serum |
s4 |
8 |
121 |
757 |
71 |
94 |
|
Serum |
s5 |
18 |
132 |
820 |
72 |
101 |
|
Serum |
s6 |
8 |
104 |
655 |
61 |
81 |
|
|
|
Mean |
70 |
91 |
||
|
|
|
|
|
Min |
61 |
81 |
|
|
|
|
|
Max |
78 |
101 |
Intact FGF23 ELISA Dilution Linearity & Paralellism
Tests of dilution linearity and parallelism ensure that both endogenous and recombinant samples containing FGF23 behave in a dose dependent manner and are not affected by matrix effects. Dilution linearity assesses the accuracy of measurements in diluted human samples spiked with known concentrations of recombinant analyte. By contrast, parallelism refers to dilution linearity in human samples and provides evidence that the endogenous analyte behaves in the same way as the recombinant one. Dilution linearity and parallelism are assessed for each sample type and should be within 20% of the expected concentration.
Dilution Linearity
Dilution linearity was assessed by serially diluting human samples spiked with 800 pg/ml recombinant human intact FGF23 with assay buffer.
The table below shows the mean recovery and range of serially diluted recombinant human intact FGF23 in several sample matrices.
|
% Recovery of recombinant iFGF23 in diluted samples |
|||||||
|
|
1+1 |
1+3 |
1+7 |
||||
|
Sample matrix |
n |
Mean |
Range |
Mean |
Range |
Mean |
Range |
|
EDTA plasma |
6 |
119 |
78-145 |
111 |
95-160 |
110 |
93-157 |
|
Heparın plasma |
1 |
133 |
- |
102 |
- |
98 |
- |
|
Citrate plasma |
1 |
126 |
- |
126 |
- |
118 |
- |
|
Serum |
6 |
103 |
91-118 |
101 |
94-109 |
126 |
100-149 |
Data showing dilution linearity of human EDTA plasma samples containing recombinant human intact FGF23:
|
iFGF23 [pg/ml] |
Recovery (%) |
|||||||
|
Sample matrix |
ID |
Reference |
1+1 |
1+3 |
1+7 |
1+1 |
1+3 |
1+7 |
|
EDTA plasma |
e1 |
801 |
461 |
239 |
107 |
115 |
104 |
93 |
|
EDTA plasma |
e2 |
765 |
298 |
238 |
117 |
78 |
160 |
157 |
|
EDTA plasma |
e3 |
719 |
447 |
235 |
117 |
124 |
105 |
105 |
|
EDTA plasma |
e4 |
694 |
447 |
216 |
112 |
129 |
96 |
100 |
|
EDTA plasma |
e5 |
783 |
483 |
229 |
117 |
123 |
95 |
97 |
|
EDTA plasma |
e6 |
645 |
467 |
242 |
123 |
145 |
104 |
105 |
|
|
|
|
|
|
Mean |
119 |
111 |
110 |
|
|
|
|
|
|
Min |
78 |
95 |
93 |
|
|
|
|
|
|
Max |
145 |
160 |
157 |
Data showing dilution linearity of a human heparın plasma sample containing recombinant human intact FGF23:
|
iFGF23 [pg/ml] |
Recovery (%) |
|||||||
|
Sample matrix |
ID |
Reference |
1+1 |
1+3 |
1+7 |
1+1 |
1+3 |
1+7 |
|
Heparın plasma |
h1 |
673 |
448 |
228 |
110 |
133 |
102 |
98 |
Data showing dilution linearity of a human citrate plasma sample containing recombinant human intact FGF23n:
|
iFGF23 [pg/ml] |
Recovery (%) |
|||||||
|
Sample matrix |
ID |
Reference |
1+1 |
1+3 |
1+7 |
1+1 |
1+3 |
1+7 |
|
Citrate plasma |
c1 |
834 |
527 |
262 |
123 |
126 |
126 |
118 |
Data showing dilution linearity of human Serum samples containing recombinant human intact FGF23:
|
iFGF23 [pg/ml] |
Recovery (%) |
|||||||
|
Sample matrix |
ID |
Reference |
1+1 |
1+3 |
1+7 |
1+1 |
1+3 |
1+7 |
|
Serum |
s1 |
892 |
528 |
242 |
134 |
118 |
109 |
120 |
|
Serum |
s2 |
906 |
489 |
238 |
152 |
108 |
105 |
134 |
|
Serum |
s3 |
793 |
418 |
202 |
148 |
105 |
102 |
149 |
|
Serum |
s4 |
791 |
397 |
198 |
130 |
100 |
100 |
132 |
|
Serum |
s5 |
793 |
371 |
186 |
122 |
94 |
94 |
123 |
|
Serum |
s6 |
816 |
373 |
193 |
102 |
91 |
95 |
100 |
|
|
|
|
|
|
Mean |
103 |
101 |
126 |
|
|
|
|
|
|
Min |
91 |
94 |
100 |
|
|
|
|
|
|
Max |
118 |
109 |
149 |
Parallelism
Parallelism was assessed by serially diluting human samples containing endogenous intact FGF23 with assay buffer.
The table below shows the mean recovery and range of serially diluted endogenous intact FGF23 in several sample matrices:
|
|
% Recovery of endogenous iFGF23 in diluted samples |
||||||
|
|
1+1 |
1+3 |
1+7 |
||||
|
Sample matrix |
n |
Mean |
Range |
Mean |
Range |
Mean |
Range |
|
EDTA plasma |
5 |
107 |
100-116 |
108 |
88-124 |
111 |
84-136 |
|
Heparın plasma |
1 |
99 |
- |
97 |
- |
107 |
- |
|
Citrate plasma |
1 |
143 |
- |
137 |
- |
130 |
- |
|
Serum |
6 |
87 |
85-90 |
74 |
72-79 |
67 |
61-74 |
Data showing dilution linearity of endogenous intact FGF23 in human EDTA plasma samples:
|
iFGF23 [pg/ml] |
Recovery (%) |
|||||||
|
Sample matrix |
ID |
Reference |
1+1 |
1+3 |
1+7 |
1+1 |
1+3 |
1+7 |
|
EDTA plasma |
e1 |
539 |
308 |
167 |
92 |
114 |
124 |
136 |
|
EDTA plasma |
e2 |
290 |
167 |
88 |
49 |
116 |
122 |
135 |
|
EDTA plasma |
e3 |
1 249 |
659 |
327 |
155 |
106 |
105 |
99 |
|
EDTA plasma |
e4 |
1 085 |
548 |
274 |
136 |
101 |
101 |
100 |
|
EDTA plasma |
e5 |
1 714 |
855 |
378 |
181 |
100 |
88 |
84 |
|
|
|
|
|
|
Mean |
107 |
108 |
111 |
|
|
|
|
|
|
Min |
100 |
88 |
84 |
|
|
|
|
|
|
Max |
116 |
124 |
136 |
Data showing dilution linearity of endogenous intact FGF23 in a human heparın plasma sample:
|
|
iFGF23 [pg/ml] |
Recovery (%) |
||||||
|
Sample matrix |
ID |
Reference |
1+1 |
1+3 |
1+7 |
1+1 |
1+3 |
1+7 |
|
Heparın plasma |
h1 |
438 |
216 |
106 |
58 |
99 |
97 |
107 |
Data showing dilution linearity of endogenous intact FGF23 in human citrate plasma samples:
|
iFGF23 [pg/ml] |
Recovery (%) |
|||||||
|
Sample matrix |
ID |
Reference |
1+1 |
1+3 |
1+7 |
1+1 |
1+3 |
1+7 |
|
Citrate plasma |
h1 |
143 |
103 |
49 |
23 |
143 |
137 |
130 |
Data showing dilution linearity of endogenous intact FGF23 in human Serum samples:
|
iFGF23 [pg/ml] |
Recovery (%) |
|||||||
|
Sample matrix |
ID |
Reference |
1+1 |
1+3 |
1+7 |
1+1 |
1+3 |
1+7 |
|
Serum |
s1 |
1 159 |
520 |
213 |
89 |
90 |
74 |
61 |
|
Serum |
s2 |
991 |
434 |
196 |
84 |
88 |
79 |
68 |
|
Serum |
s3 |
1 013 |
443 |
190 |
82 |
87 |
75 |
65 |
|
Serum |
s4 |
948 |
411 |
172 |
79 |
87 |
72 |
67 |
|
Serum |
s5 |
942 |
399 |
169 |
87 |
85 |
72 |
74 |
|
Serum |
s6 |
899 |
398 |
168 |
76 |
89 |
75 |
68 |
|
|
|
|
|
|
Mean |
87 |
74 |
67 |
|
|
|
|
|
|
Min |
85 |
72 |
61 |
|
|
|
|
|
|
Max |
90 |
79 |
74 |
Intact FGF23 ELISA Specificity
The specificity of an ELISA is defined as its ability to exclusively recognize the analyte of interest. The specificity of the human FGF23 (intact) human ELISA was shown by characterizing both the capture and the detection antibodies. In addition, the specificity of the ELISA was established through competition experiments, which measure the ability of the antibodies to exclusively bind to FGF23.
Information on FGF23 (intact) Antibodies
The FGF23 (intact) human ELISA is a sandwich-based immunoassay with a recombinant monoclonal anti-human FGF23 capture antibody recognizing a structural epitope in the N-terminal part of FGF23. Detection is mediated by a HRP-labeled monoclonal anti-human FGF23 antibody directed to the C-terminal part of FGF23. Therefore, specific measurement of intact FGF23 is ensured.
Competition of Signal
Competition experiments were carried out by pre-incubating human samples with an excess of capture antibody. The concentration measured in this mixture was then compared to a reference value, which was obtained from the same sample but without the pre-incubation step. Mean competition was 92%.
|
iFGF23 [pg/ml] |
|
|||
|
Sample matrix |
ID |
Reference |
Reference + capture AB |
% Competition |
|
EDTA plasma |
e1 |
24.8 | 2.2 | 91 |
|
EDTA plasma |
e2 |
65.6 | 7.2 | 89 |
|
Heparın plasma |
s3 |
50.6 | 2.2 | 96 |
|
Heparın plasma pool |
h1 |
153.7 | 7.2 | 95 |
|
Heparın plasma pool |
h2 |
91.9 | 6.2 | 93 |
|
Heparın plasma pool |
h3 |
42.4 | 7.2 | 83 |
|
Citrate plasma |
c1 |
41.3 | 0 |
100 |
|
Plasma |
p1 |
502.1 | 9.2 |
98 |
|
Serum |
s1 |
73.7 | 6.2 |
92 |
|
Serum |
s2 |
29.3 | 5.2 |
82 |
|
Serum |
s3 |
119.4 | 7.2 |
94 |
|
Mean |
92 |
|||
Isoforms
There are no isoforms of human FGF23 known.
Cross-Reactivity
FGF23 (intact) human ELISA recognizes endogenous and recombinant human intact FGF23. The assay does not cross-react with FGF3, FGF19 and FGF21.
Sample Stability
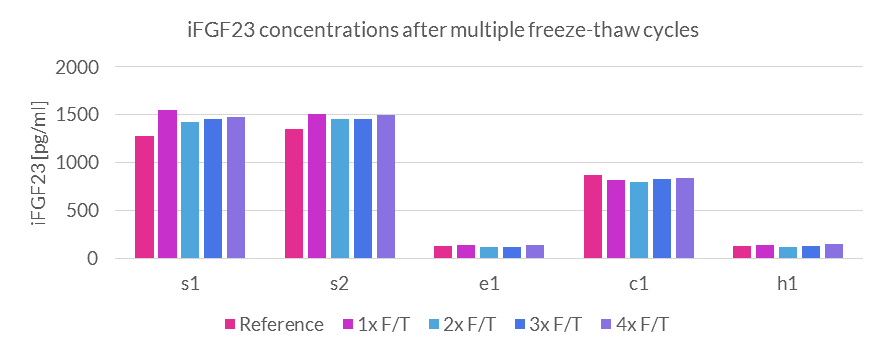
The stability of endogenous intact FGF23 was tested by comparing four measurements in samples that had undergone four freeze-thaw cycles (F/T).
For freeze-thaw experiments, samples were collected according to the supplier’s instruction using blood collection devices and stored at -80°C. Reference samples were freeze-thawed once. Samples can undergo at least four freeze-thaw cycles. The mean recovery of sample concentration after four freeze-thaw cycles is 109%.
Intact FGF23 concentrations of samples after freeze-thaw cycles:
|
iFGF23 [pg/ml] |
Recovery (%) 4x F/T vs Reference |
||||||
|
Sample matrix |
ID |
Reference |
1x |
2x |
3x |
4x |
|
|
Serum |
s1 |
1274 | 1547 | 1424 | 1456 | 1478 | 116 |
|
Serum |
s2 |
1348 |
1507 |
1458 |
1460 |
1495 |
111 |
|
EDTA plasma |
e1 |
131 |
144 |
117 |
121 |
143 |
109 |
|
Citrate plasma |
c1 |
871 |
823 |
803 |
826 |
844 |
97 |
|
Heparın plasma |
h1 |
131 |
138 |
116 |
133 |
148 |
113 |
|
Mean |
109 |
||||||
Sample Values
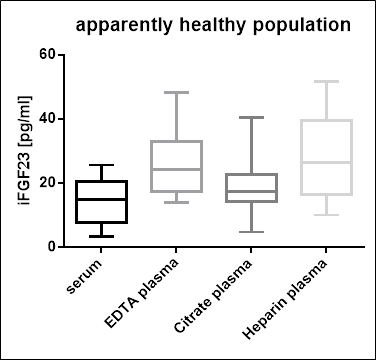
Intact FGF23 Values in Apparently Healthy Individuals
To provide values for circulating intact FGF23 in apparently healthy individuals, a panel of samples was tested. Each individual donated blood for all tested matrices.
A summary of the results is shown below:
|
iFGF23 [pg/ml] |
||||||
|
Sample matrix |
n |
Mean |
Median |
Range |
5% Percentile |
95% Percentile |
|
EDTA plasma |
22 |
26.1 |
24.4 | 14.0-48.3 | 14.2 | 47.5 |
|
Heparın plasma |
22 |
27.7 |
26.4 | 10.1-51.8 | 10.1 | 50.7 |
|
Citrate plasma |
22 |
19.7 |
17.4 | 4.8-51.8 | 5.8 | 40.4 |
|
Serum |
22 |
14.1 |
14.8 | 3.6-25.7 | 3.8 | 25.0 |
It is recommended to establish the normal range for each laboratory.
Intact FGF23 Values in Disease Panels
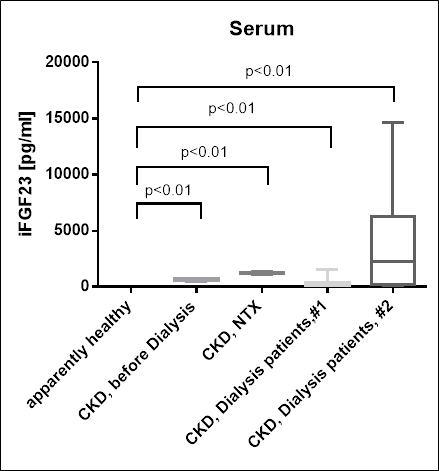
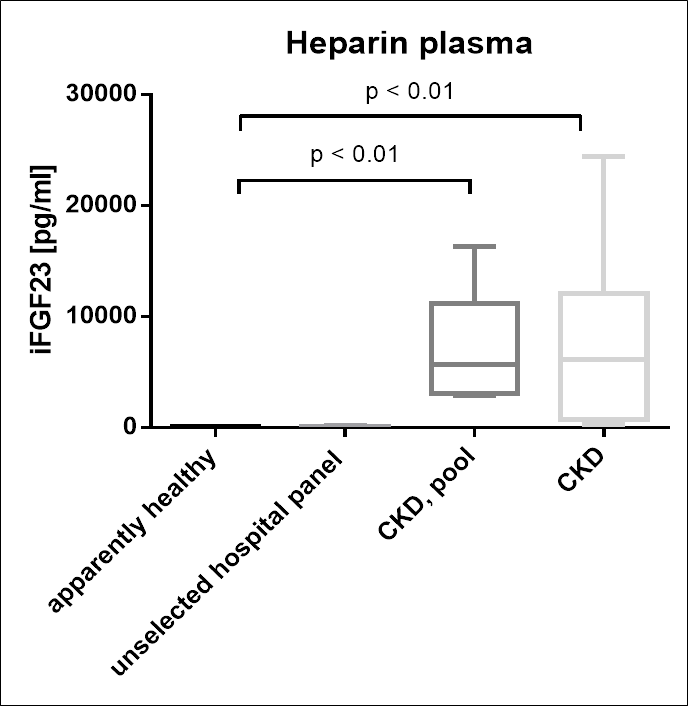
In addition to samples from apparently healthy donors, panels of samples from chronic kidney disease (CKD) patients, CKD patients on dialysis, CKD patients with a kindey transplant (NTX) as well as an unselected hospital panel were tested.
Summary of the results obtained with several disease panels:
|
iFGF23 [pg/ml] |
|||||
|
Cohort |
Sample matrix |
n |
Mean |
Median |
Range |
|
CKD |
Serum |
6 |
623 |
653 |
446-685 |
|
CKD, NTX |
Serum |
15 |
1194 |
1172 |
1089-1309 |
|
Dialysis #1 |
Serum |
7 |
340 |
136 |
40-1539 |
|
Dialysis #2 |
Serum |
9 |
4039 |
2227 |
146-14602 |
|
CKD |
Heparın plasma |
8 |
7799 |
6104 |
256-24366 |
|
CKD, pool |
Heparın plasma |
10 |
7324 |
5647 |
2922-16283 |
|
Unselected hospital panel |
Heparın plasma |
14 |
28 |
33 |
22-127 |
Comparison of Intact FGF23 Values in Apparently Healthy Individuals and Disease Panels
Matrix Comparison
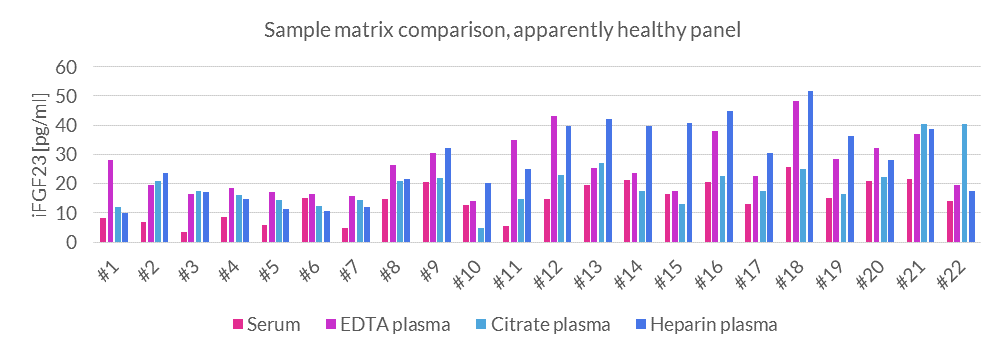
To assess whether all tested matrices behave the same way in the FGF23 (intact) human ELISA, concentrations of FGF23 were measured in EDTA plasma, heparın plasma, citrate plasma and serum samples prepared from 22 apparently healthy donors. Each individual donated blood in all tested sample matrices.
|
iFGF23 [pg/ml] |
||||
|
Donor ID |
EDTA plasma |
Citrate plasma |
Heparın plasma |
Serum |
|
#1 |
28 |
12 |
10 |
8 |
|
#2 |
19 |
21 |
24 |
7 |
|
#3 |
17 |
18 |
17 |
4 |
|
#4 |
18 |
16 |
15 |
9 |
|
#5 |
17 |
14 |
11 |
6 |
|
#6 |
17 |
12 |
11 |
15 |
|
#7 |
16 |
14 |
12 |
5 |
|
#8 |
26 |
21 |
22 |
15 |
|
#9 |
30 |
22 |
32 |
21 |
|
#10 |
14 |
5 |
20 |
13 |
|
#11 |
35 |
15 |
25 |
6 |
|
#12 |
43 |
23 |
40 |
15 |
|
#13 |
25 |
27 |
42 |
20 |
|
#14 |
24 |
17 |
40 |
21 |
|
#15 |
17 |
13 |
41 |
16 |
|
#16 |
38 |
23 |
45 |
20 |
|
#17 |
23 |
17 |
31 |
13 |
|
#18 |
48 |
25 |
52 |
26 |
|
#19 |
28 |
16 |
36 |
15 |
|
#20 |
32 |
22 |
28 |
21 |
|
#21 |
37 |
40 |
39 |
22 |
|
#22 |
20 |
40 |
18 |
14 |
Measured values of human intact FGF23 in serum are lower compared to plasma in an apparently healthy cohort (n=22).
It has been shown that FGF23 values differ between serum and plasma. The reasons for this difference are still unclear, however, it is assumed that coagulation processes under conditions of serum collection might reduce the accessibility of recognizable determinants.
Figure showing matrix comparison of intact FGF23 sample concentrations between serum, EDTA plasma, citrate plasma, and heparın plasma in an apparently healthy cohort (n=22).
Correlation of intact FGF23 measurements in Serum and Plasma Samples
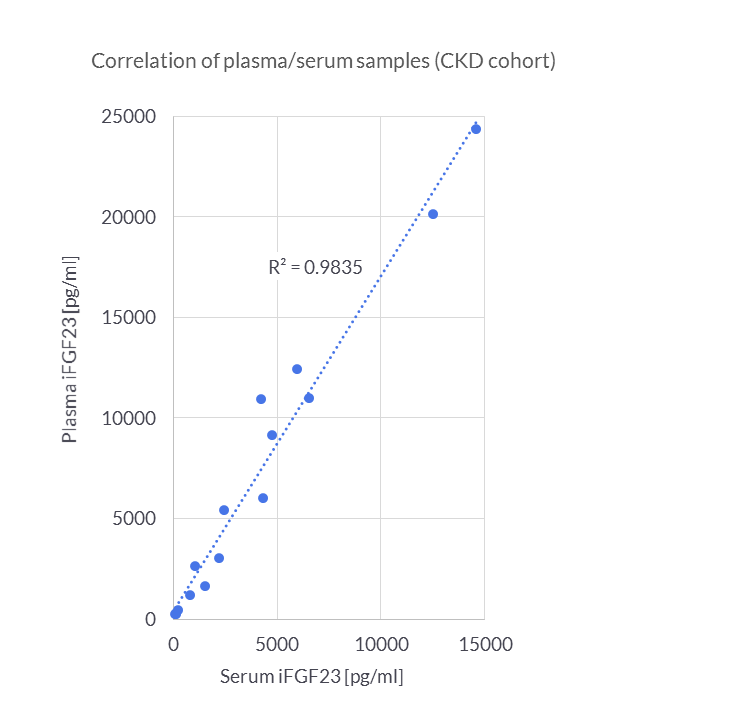
intact FGF23 concentrations were assessed in serum and plasma samples from 16 patients with chronic kidney disease (dialysis). Correlations between serum and plasma samples were calculated (R2=0.9834).
Comparison with Other FGF23 (intact) human ELISAs
Assay Characteristics of Different FGF23 (intact) human ELISA Kits
|
Manufacturer |
Biomedica |
Kainos |
Immutopics |
|
Assay type |
Sandwich ELISA |
Sandwich ELISA |
Sandwich ELISA |
|
Sample matrix |
Plasma, serum, cell culture supernatant, urine |
Serum (preferred matrix), plasma |
Plasma, cell culture supernatant |
|
Sample volume |
50 µl |
50 µl |
50 µl |
|
Incubation scheme |
One-step 3 h / 30 min |
Two-step 2 h / 1 h / 30 min |
Two-step 2 h / 1 h / 30 min |
|
Shaker required |
- |
yes |
yes |
|
Standards |
7 vials, lyophilized, in a human plasma matrix |
7 vials in buffered base |
6 vials, lyophilized in protein matrix |
|
Standard range |
0 - 1600 pg/ml |
0 - 800 pg/ml |
0 - 2410 pg/ml |
|
Controls |
2 vials, lyophilized |
- |
2 vials, lyophilized |
|
Validation |
According to FDA/ICH/EMEA | basic | basic |
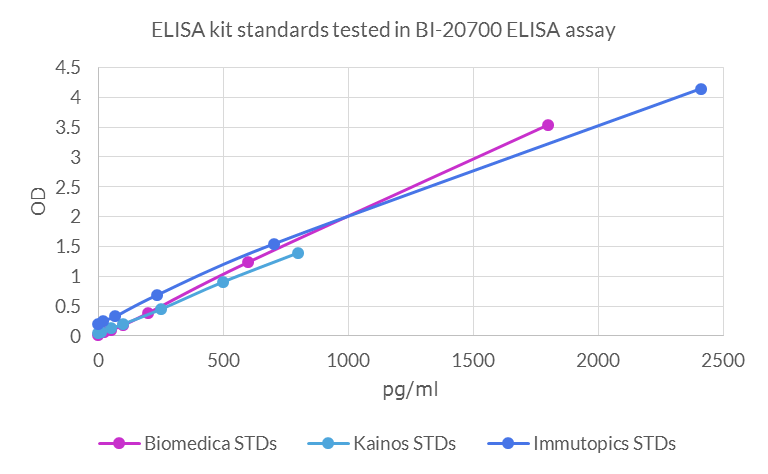
Measurement of Intact FGF23 Standards From Different ELISA Manufacturers in the Biomedica FGF23 (intact) human ELISA
Three different recombinant intact FGF23 standards (STDs) (Biomedica, Kainos, Immutopics) were measured in the Biomedica FGF23 (intact) human ELISA:
Comparison of Sample Concentratons in Different FGF23 (intact) human ELISA Kits
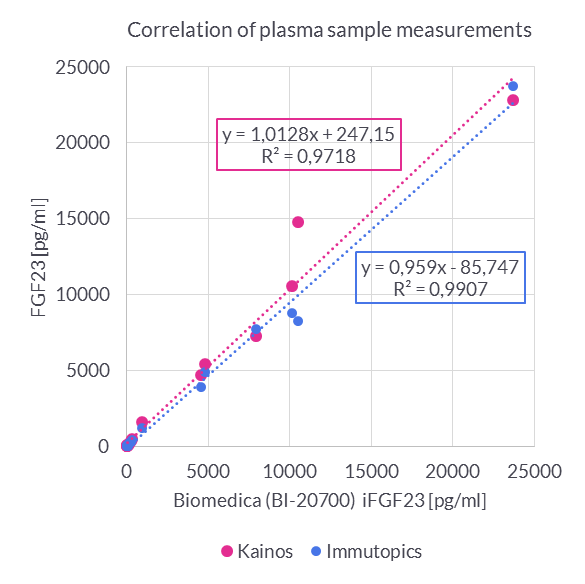
The Biomedica FGF23 (intact) human ELISA was compared with other FGF23 (intact) ELISA assays using plasma samples from 17 donors (samples from apparently healthy individuals and CKD patients).
The correlation between the Biomedica and the Kainos ELISA is R2 = 0.9718.
The correlation between the Biomedica and the Immutopics ELISA is R2 = 0.9907.
Plasma samples tested in three assays, comparison of concentrations:
| Manufacturer | |||
|
|
Biomedica |
Kainos |
Immutopics |
|
Sample ID |
iFGF23 [pg/ml] |
||
|
plasma#1 |
4831 |
5443 |
4902 |
|
plasma#2 |
7915 |
7257 |
7706 |
|
plasma#3 |
30 |
40 |
39 |
|
plasma#4 |
348 |
504 |
409 |
|
plasma#5 |
32 |
120 |
15 |
|
plasma#6 |
69 |
124 |
- |
|
plasma#7 |
10497 |
14794 |
8245 |
|
plasma#8 |
4593 |
4675 |
3909 |
|
plasma#9 |
10140 |
10569 |
8760 |
|
plasma#10 |
23710 |
22813 |
23715 |
|
plasma#11 |
268 |
357 |
279 |
|
plasma#12 |
128 |
174 |
196 |
|
plasma#13 |
947 |
1600 |
1244 |
|
plasma#14 |
43 |
51 |
45 |
|
plasma#15 |
54 |
92 |
64 |
|
plasma#16 |
50 |
39 |
36 |
|
plasma#17 |
75 |
92 |
98 |
Performance Check Urine
Accuracy
The accuracy of the FGF23 (intact) human ELISA was measured by adding recombinant intact FGF23 to urine samples containing a known concentration endogenous intact FGF23. The %recovery of the spiked concentration was calculated as the percentage of measured compared over the expected value.
The table shows the summary of the recovery experiments in the FGF23 (intact) human ELISA in urine samples:
|
iFGF23 [pg/ml] |
Recovery (%) |
|||
|
Sample matrix |
ID |
Reference |
+300 pg/ml |
+300 pg/ml |
|
Urine |
u1 |
44.6 |
316.0 |
98 |
|
Urine |
u2 |
8.3 |
284.8 |
94 |
|
Urine |
u3 |
2.9 |
293.3 |
97 |
|
Urine |
u4 |
0.0 |
254.5 |
85 |
|
|
|
Mean |
93 |
|
Dilution Linearity
Dilution linearity was assessed by serially diluting urine samples spiked with 300 pg/ml recombinant intact FGF23 with assay buffer.
The table below shows the mean recovery and range of serially diluted recombinant intact FGF23 in urine samples:
|
iFGF23 [pg/ml] |
Recovery (%) |
|||||
|
Sample matrix |
ID |
Reference |
1+1 |
1+3 |
1+1 |
1+3 |
|
Urine |
u1 |
316 |
156 |
86 |
98 |
109 |
|
Urine |
u2 |
285 |
148 |
74 |
104 |
103 |
|
Urine |
u3 |
293 |
153 |
83 |
104 |
113 |
|
Urine |
u4 |
255 |
143 |
79 |
113 |
124 |
|
|
|
|
Mean |
105 |
112 |
|
Parallelism
Parallelism was assessed by serially diluting urine samples containing endogenous levels of intact FGF23 with assay buffer.
The table below shows the mean recovery and range of serially diluted endogenous intact FGF23 in urine samples:
|
iFGF23 [pg/ml] |
Recovery (%) |
|||||||
|
Sample matrix |
ID |
Reference |
1+1 |
1+3 |
1+7 |
1+1 |
1+3 |
1+7 |
|
Urine |
u1 |
44.6 |
14.0 |
|
|
63 |
|
|
|
Urine |
u2 |
3403 |
|
957 |
474 |
|
113 |
111 |
Intact FGF23 Values in Urine Samples
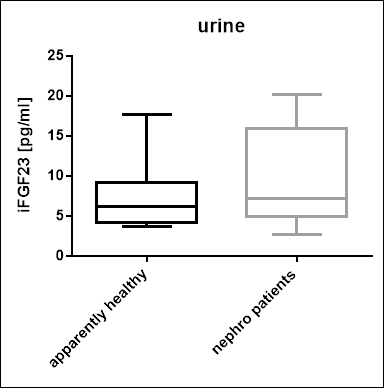
Intact FGF23 urine values in various cohorts:
|
iFGF23 [pg/ml] |
|||||
|
Cohort |
Sample matrix |
n |
Mean |
Median |
Range |
|
Apparently healthy |
Urine |
7 |
7.7 |
6.2 |
3.7-17.7 |
|
CKD |
Urine |
9 |
9.5 |
7.2 |
2.7-20.2 |
Performance Check Cell Culture Supernatant
Standard Curve for Cell Culture Supernatant Measurements
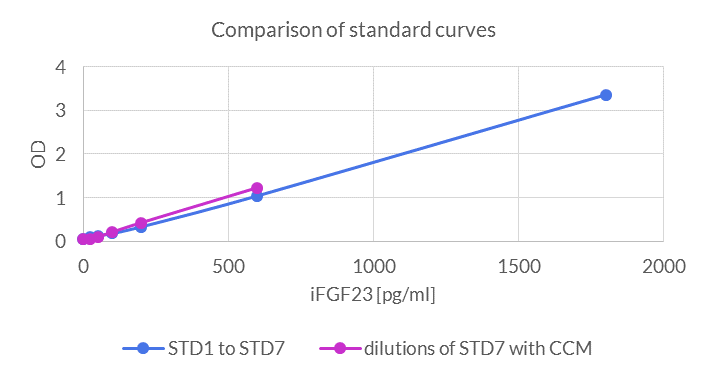
Comparison of the FGF23 (intact) ELISA standard curve with the calibrator (STD7) diluted in DMEM cell culture medium (CCM) supplemented with 10% FCS and 1% P/S.
Accuracy
The accuracy of the FGF23 (intact) human ELISA was measured by adding recombinant intact FGF23 to cell culture supernatants (CCS) of two human breast cancer cell lines and DMEM cell culture medium (CCM) supplemented with 10% FCS and 1% P/S. The %recovery of the spiked concentration was calculated as the percentage of measured compared over the expected value.
The table shows the summary of the recovery experiments in the FGF23 (intact) human ELISA in cell culture supernatants and cell culture medium:
|
OD |
Recovery (%) |
|||
|
Sample matrix |
ID |
Reference |
+900 pg/ml |
+900 pg/ml |
|
CCS |
ccs1 |
0.045 |
1.899 |
123 |
|
CCS |
ccs2 |
0.023 |
1.824 |
118 |
|
CCM |
ccm1 |
0.045 |
1.724 |
111 |
|
CCM |
ccm2 |
0.045 |
1.547 |
100 |
|
|
|
Mean |
117 |
|
Dilution Linearity
Dilution linearity was assessed by serially diluting cell culture supernatants (CCS) of two human breast cancer cell lines and DMEM cell culture medium (CCM, supplemented with 10% FCS and 1% P/S) samples spiked with 900 pg/ml recombinant intact FGF23 with CCM.
The table below shows the mean recovery and range of serially diluted recombinant intact FGF23 in cell culture supernatants and cell culture medium:
|
OD |
Recovery (%) |
|||||
|
Sample matrix |
ID |
Reference |
1+1 |
1+3 |
1+1 |
1+3 |
|
CCS |
ccs1 |
1.899 |
0.975 |
0.512 |
100 |
105 |
|
CCS |
ccs2 |
1.824 |
0.891 |
0.456 |
95 |
98 |
|
CCM |
ccm1 |
1.724 |
0.891 |
0.456 |
101 |
103 |
|
|
|
|
Mean |
99 |
102 |
|
- Phosphate Concentrations and Modifying Factors in Healthy Children From 12 to 24 Months of Age. Koljonen L, Enlund-Cerullo M, Hauta-Alus H, Holmlund-Suila E, Valkama S, Rosendahl J, Andersson S, Pekkinen M, Mäkitie O. J Clin Endocrinol Metab. 2021 Sep 27;106(10):2865-2875. doi: 10.1210/clinem/dgab495. PMID: 34214153; PMCID: PMC8475199.
- Osteoglycin as a Potential Biomarker of Mild Kidney Function Impairment in Type 2 Diabetes Patients. González-Salvatierra S, García-Fontana C, Andújar-Vera F, Grau-Perales AB, Martínez-Heredia L, Avilés-Pérez MD, Hayón-Ponce M, Iglesias-Baena I, Riquelme-Gallego B, Muñoz-Torres M, García-Fontana B.J Clin Med. 2021 May 20;10(10):2209. doi: 10.3390/jcm10102209. PMID: 34065223; PMCID: PMC8161135
- C-terminal and intact FGF23 in kidney transplant recipients and their associations with overall graft survival. Chu C, Elitok S, Zeng S, Xiong Y, Hocher CF, Hasan AA, Krämer BK, Hocher B. BMC Nephrol. 2021 Apr 8;22(1):125. doi: 10.1186/s12882-021-02329-7.
- Serum levels of C-terminal FGF23 (cFGF23) are associated with 1-year-mortality in patients undergoing transcatheter aortic valve replacement (TAVR). Mirna M, Lauten A, Jirak P, Rezar R, Wernly B, Paar V, Felder TK, Hoppe UC, Motloch LJ, Jung C, Alushi B, Lichtenauer M, Salmhofer H. Eur J Intern Med. 2021 Mar;85:98-107.
- Relationship between GFR, intact PTH, oxidized PTH, non-oxidized PTH as well as FGF23 in patients with CKD. Zeng, S., Querfeld, U., Feger, M., Haffner, D., Hasan, A.A., Chu, C., Slowinski, T., Dschietzig, T.B., Schäfer, F., Xiong, Y., Zhang, B., Rausch, S., Horvathova, K., Lang, F., Krämer, B.K., Föller, M., Hocher B., Affiliations expand, PMID: FASEB J . 2020 Sep 22. doi: 10.1096/fj.202000596R. Online ahead of print.
- The Role of FGF 23 in CKD Progression in Children. Balmukhanova, A., Kabulbayev, K., Kanatbayeva, A., Alpay, H., Balmukhanova A., Shepetov, A., 2020, in: Nephrology Dialysis Transplantation, Volume 35, Issue Supplement_3, June 2020,
- Novel ELISA for the detection of intact FGF23 in patients with chronic kidney disease. Wallwitz, J., Gadermaier, E., Berg, G., Gottfried, H. 2019. Nephrology Dialysis Transplantation, Volume 34, Issue Supplement_1, gfz103.SP316. Link to poster.
- Development and validation of a novel ELISA for the detection of intact FGF23 in serum and plasma. Bitzer, A., Wallwitz, J., Berg, G., Himmler, G., 2019, in: Osteologie. Presented at the OSTEOLOGIE 2019, Georg Thieme Verlag KG, p. V 3.4.
- Detection of intact FGF23 using a novel well-characterized ELISA. Wallwitz, J., Gadermaier, E., Bitzer, A., Himmler, G., 2019. Presented at the 9th International Conference on Children, BioScientifica.
 Download biomedica product list


